
September 17, 2026 0 Comments
What is a Candlestick?
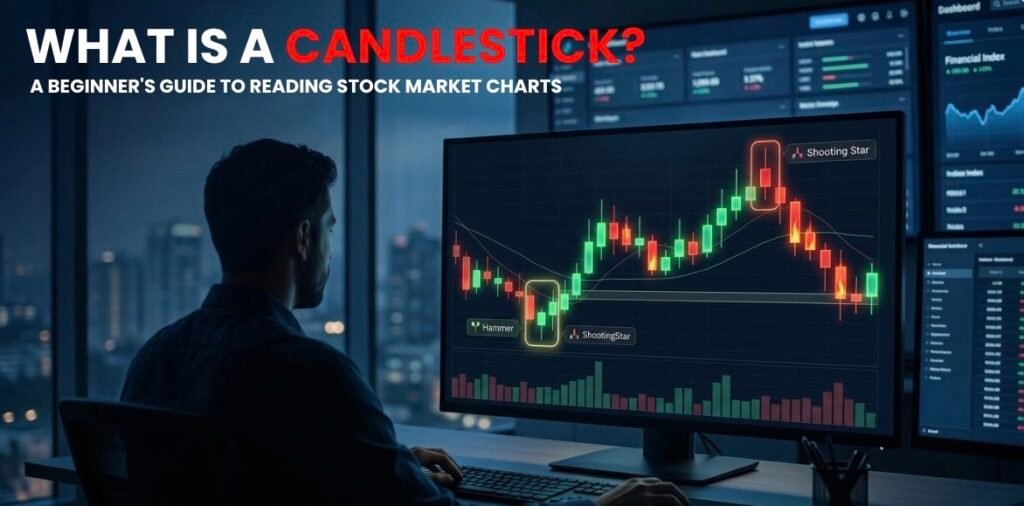
The candlestick chart is a technical indicator used in the stock market that represents price movement. If you are learning chart reading at a share market institute like Stock Brain in Noida, understanding this basic tool is essential. Unlike the traditional line chart, which represents the closing price, a candlestick shows more about the fight between the buyers and sellers for some particular time period (5 min, 1 hour or 1 day).
Any candle consists of three elements:
- The Body – the colored wide bar. Represents the difference in price between the beginning and the end of the session.
- The Wicks or Shadows – the thin line going above and below the wide body. Represents the maximum and minimum price of the session.
- The Color – usually is either green (bullish) or red (bearish).
The Two Kinds of Candlesticks
1. Green Candle (Bullish)
A candle becomes green when the closing price of the session is higher than the opening price. This means that buyers dominated during the whole session.
- Open – the lower side of the wide green body.
- Close – the upper side of the wide green body.
- High – the upper point of the upper wick.
- Low – the lower point of the lower wick.
2. The Red Candle (Bearish)
A candle becomes red if the close is below the open. This means that sellers were dominant and forced the price to go down.
- Open – The top of the thick red body.
- Close – The bottom of the thick red body.
- High – The top of the upper wick.
- Low – The bottom of the lower wick.
How to Understand the Story (Market Psychology)
For understanding a chart in the stock market, it’s not enough to just look at the colors of candles. The shapes tell us more about market emotions, a core topic we focus on at Stock Brain, a leading share market institute in Noida.
- The Long Body vs. The Short Body: The very long green body is a sign of strong buying pressure. When the body is short it means neither buyers nor sellers could influence the price, it’s a sign of indecision (Doji).
- Long Upper Wicks: If the candle has a long upper wick, it shows that buyers tried to force the price significantly higher, but were unsuccessful in their attempt, and the sellers entered in significant numbers and lowered the price again. It is a signal of weakening the upward trend.
- Long Lower Wicks: If the candle has a long lower wick, it means that sellers tried to drive the price lower, but were unsuccessful, and buyers intervened aggressively in lower prices and pushed the market higher.
Essential Candlesticks for Any Beginner
The Hammer (Bullish Reversal)
- What it is: A small body near the top with a very long lower wick (like a home hammer).
- What it means: Appears at the end of a downward trend. Shows that even though sellers tried to drive prices lower, buyers aggressively rejected low prices.
Shooting Star (Bearish Reversal Pattern)
- Appearance: A small body at the bottom with a very long upper shadow.
- Meaning: Appearing at the peak of an upward trend. This is an indication that the buying pressure tried to push the price upward but was completely overcome by sellers.
Golden Rule of Chart Analysis
Always read candlesticks in combination with other key components of the chart analysis. A hammer pattern or a shooting star is never enough to make you think that market is going to reverse. As taught at Stock Brain (share market institute in Noida), smart traders in the stock market always use candlesticks in combination with support and resistance levels and volume data.